A while ago I wrote a post about continuous integration with Jenkins for scala projects and I thought I would do one for node developers also. Make sure to check out my other posts about how to write your gulp files since we’ll heavily really on those gulp tasks. I will put the links at the end of this post. So what is continuous integration, at the very high level it’s about hey is the code in a good state, no matter by how many people code is being updated, how often code is being changed or of how many building blocks project consists of. When you start working on a feature you’re gonna branch of mainline and start introducing changes. At some point when you find things are broken now you have to spend time to see if it’s because of your changes or project was already in a bad state. And when you find out that it was already in a bad state you would want to start tracing. A who introduced the breaking changes and B when. So to avoid the head each and frustration what you really want to know is if project is in a good state before you even start working on it. One option would be to compile the code before you start changing it. But if code compiles is it enough? Oh you you also wanna know if unit tests are passing. But is this enough? Check for compiler warnings? Style violations? Code coverage? What if you run code coverage and it shows that it’s 85%, does it mean everything is good, what if code coverage was 95% last week and code without proper code coverage got committed and code coverage dropped (do you remember what code coverage was last week, can you even find out without going back in commits and running coverage reports on those commits.) are you sure you want to introduce your changes on top of those changes? Let’s make it even more complex, what if the project consists of many other projects and the project you’re working on brings all those dependencies tougher. Maybe you should checkout all those dependency projects and see if those are in a good state also. Let’s make it even more complex, what if the project isn’t just set of projects that get bundled into one big project. What if the whole code base consists of many micro services that talk to each other via some form of PRC. OK maybe you can manage to do all this to know if code is in a good state before you introduce your changes what about the point B I brought earlier about when code broke, because longer it was in that states longer it’s gonna take to trace the breaking change and longer to fix. Can you go and check every single project every time someone makes a commit to make sure that commit is good? Well actually you can, you just need a build server. So all those points I was bringing was about whatever your integration is it should be continuous and it’s continuous if it runs after somebody changes something (or maybe before is a better option?☺ I’ll get to this later.)
This should cover what the continuous part is but what about integration, what is it actually? I would define it as pipeline of checks that run one after another and if one fails the whole thing fails if all pass then code is good. Now let’s cover what checks you want to do. You’re the best person to know what checks you need and what you wanna track. I will cover the most common ones, at least the ones that are relevant for Node projects. Also I would cover how to do it in Jenkins since Jenkins is my preferred build server but it should me mostly similar other the other ones.
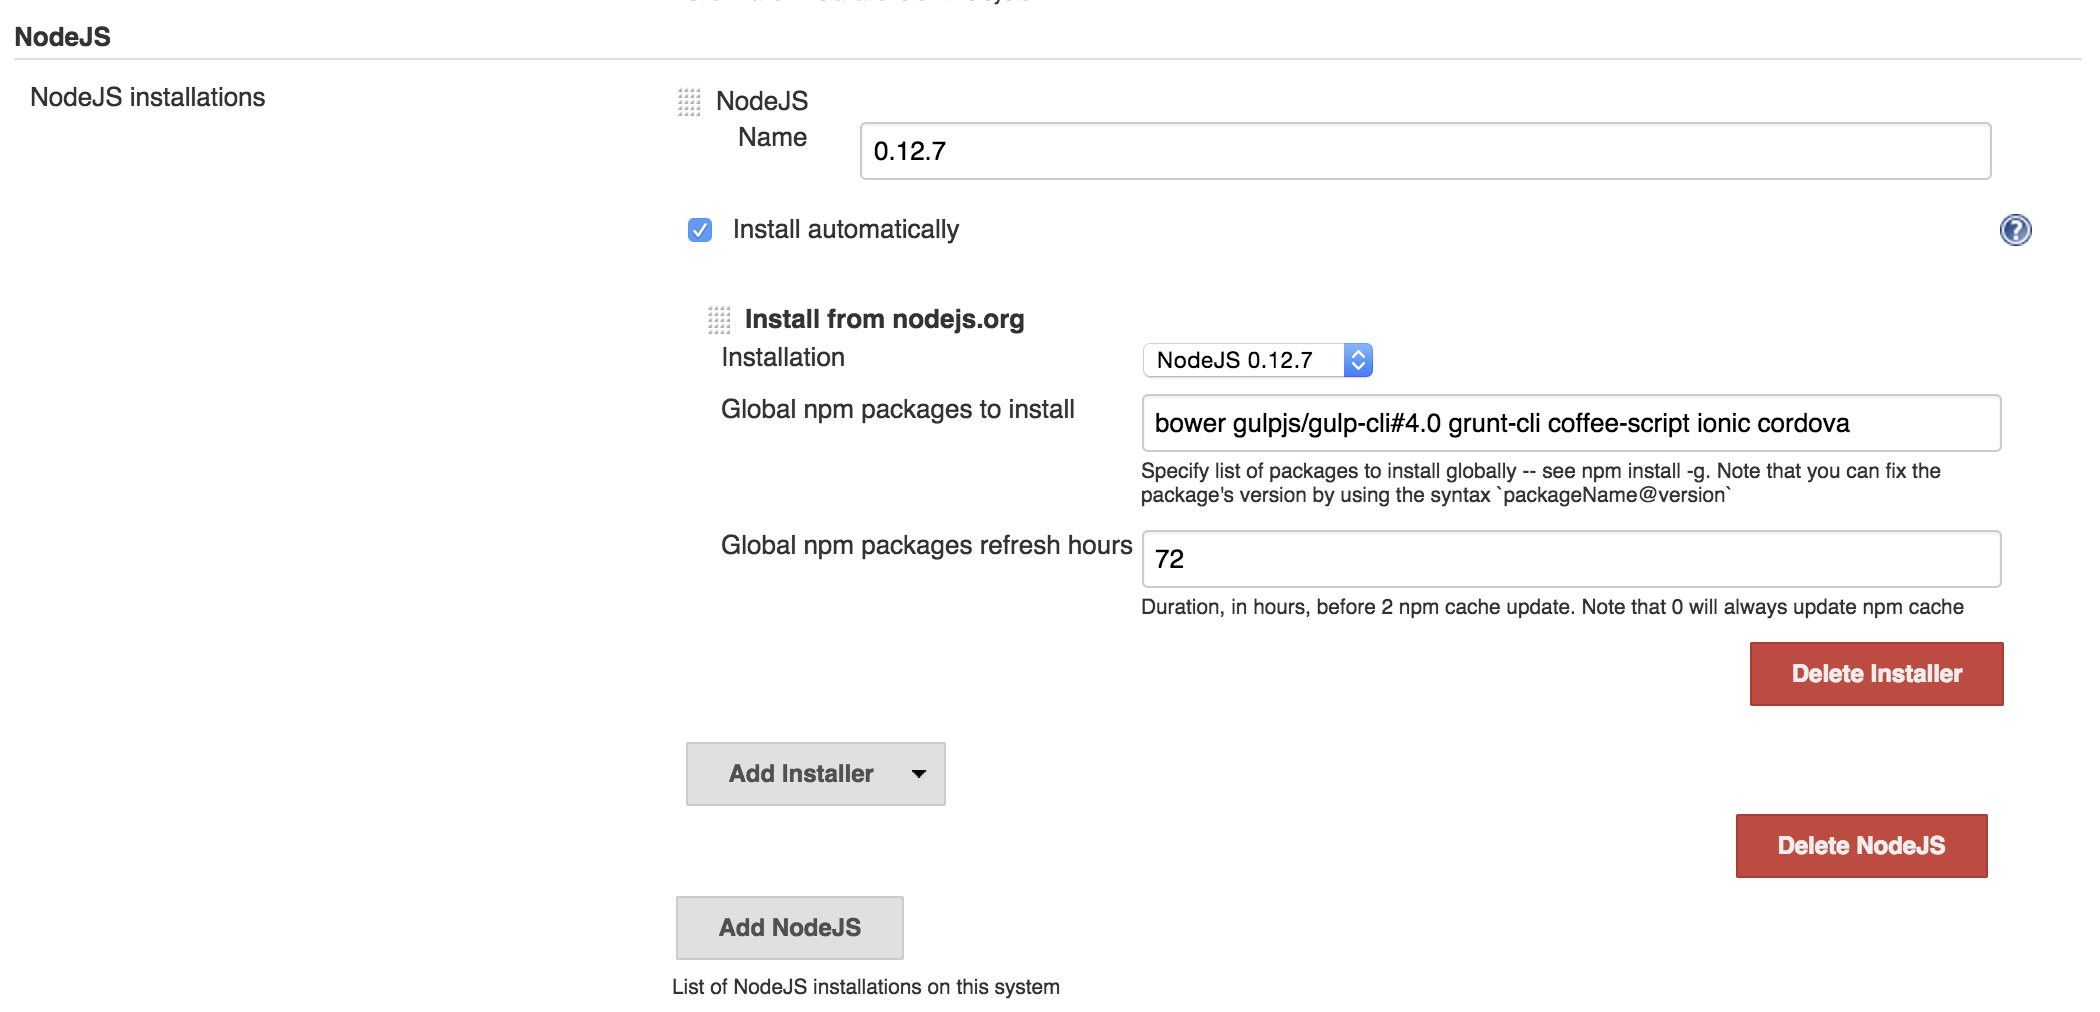
Before getting to what pipeline should be, let’s figure out what the node environment is gonna look like. One intuitive thing to do would be to install node, npm and all global packages in Jenkins box, provision it with Chef or even better, have a Jenkins docker image. There are few problems with this approach though. One is that every time you need a new global package you need to re-provision Jenkins instance or re-build the docker image. Other big problem is the versioning issue, one project may need one version of node or global packages and another project may need other version, we don’t want to be forced to upgrade all the project to latest versions in one day. What would be ideal is isolated node environments. Luckily Jenkins has NodeJS plugin. What it does it installs isolated node environments in Jenkins’s home directory. After installing it in Configure System add NodeJs Installation specify the version of node to use, global packages to install and give it a name.
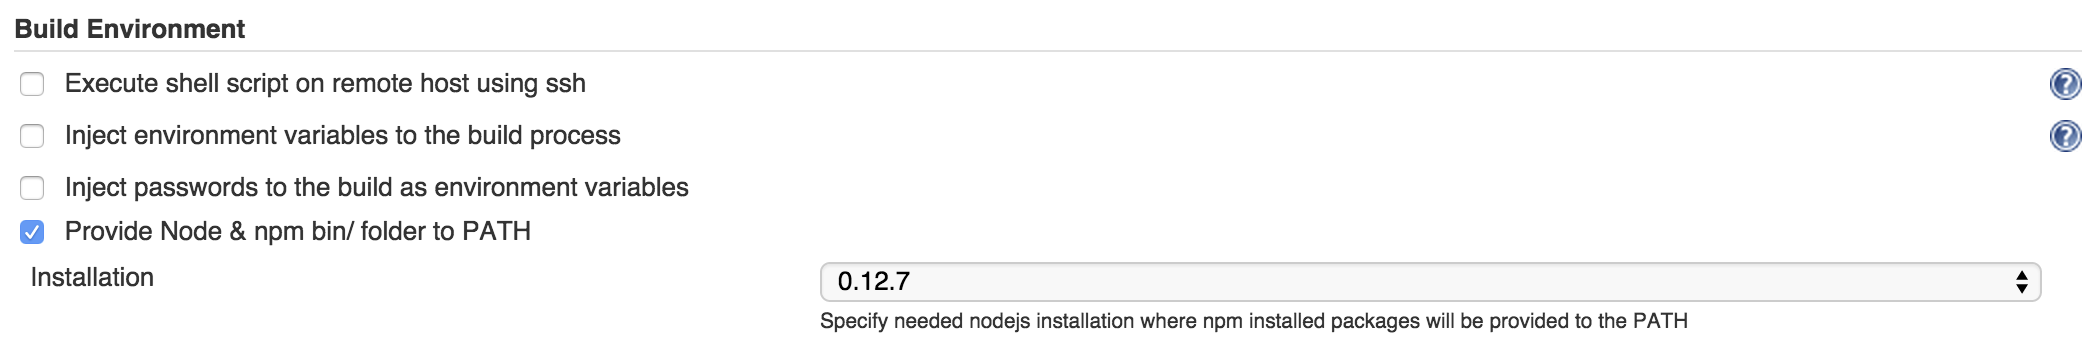
Later in job configuration, under Build Environment section, select Provide Node & npm bin/ folder to PATH and pick the node installation you wanna use for that project.
After this, we can provide the commands to execute for our build. This is how it’ll look like for library projects.
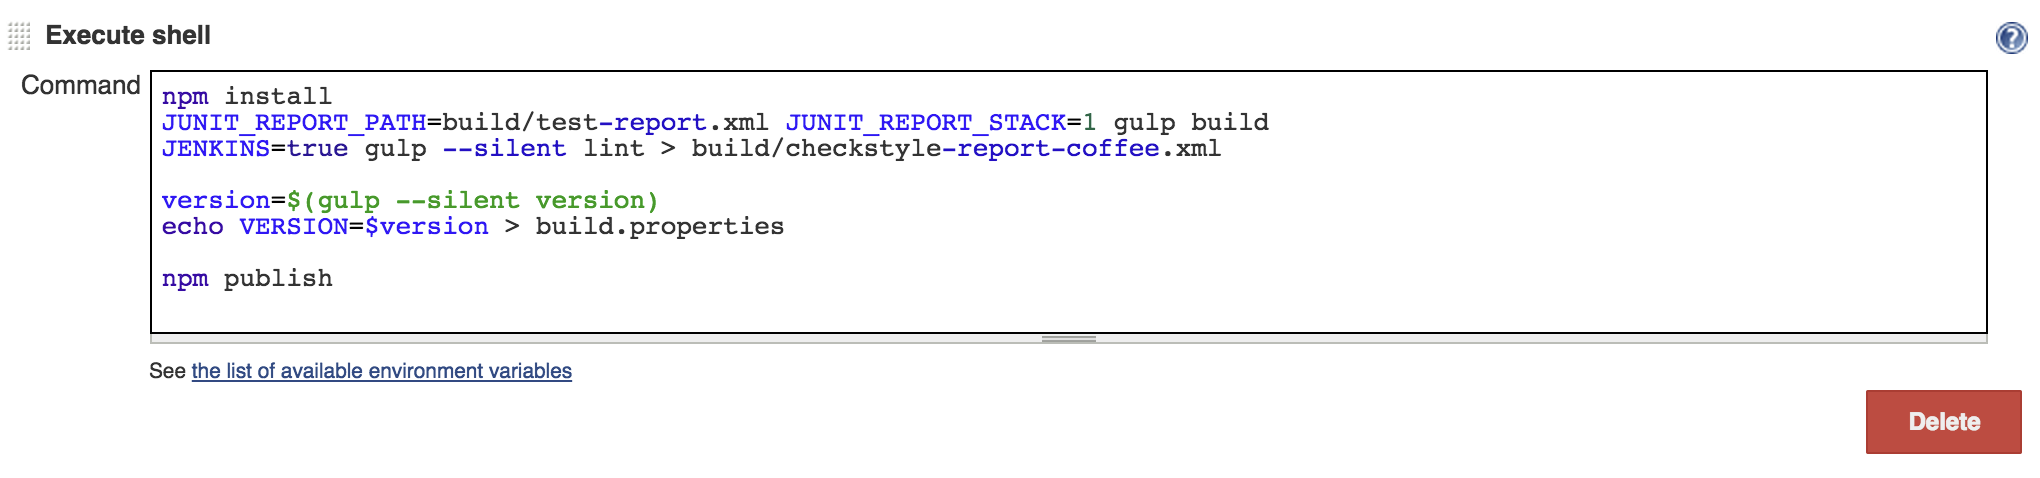
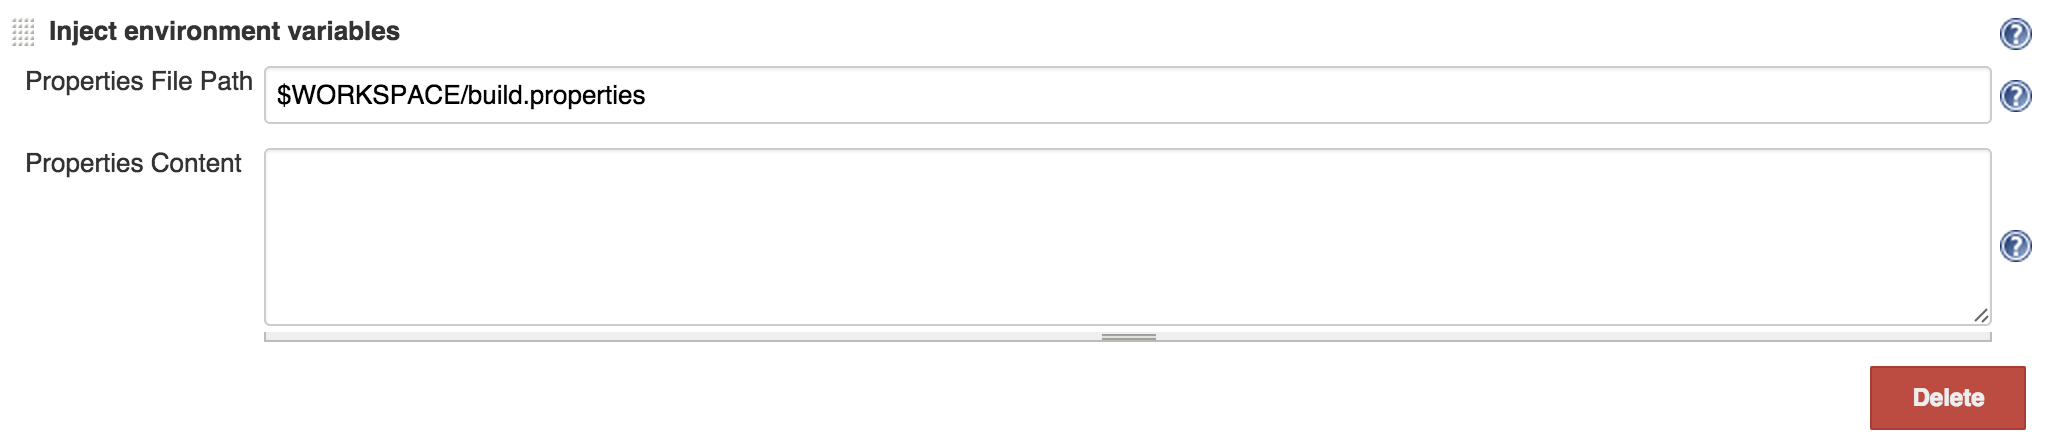
Let’s dig deep to understand what we’re doing here. First we do npm install, so if a commit has a new dependency or upgraded a dependency we’ll have it installed. Next we run gulp build, which does all the heavy lifting. It will lint the code, test it, generate coverage report, and compile CoffeeScript to JavaScript. I’m passing JUNIT_REPORT_PATH and JUNIT_REPORT_STACK environment variables to generate jUnit xml file, which we’ll use little later to generate graphs and reports. Next I run gulp lint task on it’s own, setting JENKINS environment variable so my gulp script knows that it’s running in Jenkins and it needs to generate checkstyle xml. The reason I’m running it separately and piping it to a file is because the gulp plugin I’m using for CoffeeScript linting outputs checkstyle xml on the console and the easiest way to get it into an xml file and let Jenkins’s checkstyle plugin know about it is to pipe it to a file. After the build succeeds I run npm publish to publish my npm and run gulp version, store it in build.properties which I’m gonna inject into Jenkins environment and tag the git commit with that version later.
At this point build is done. What we have is report files that we’re gonna use to generate graphs and reports. We also published the npm so let’s also tag the commit with same version. And at the end send slack and email notifications.
Checkstyle
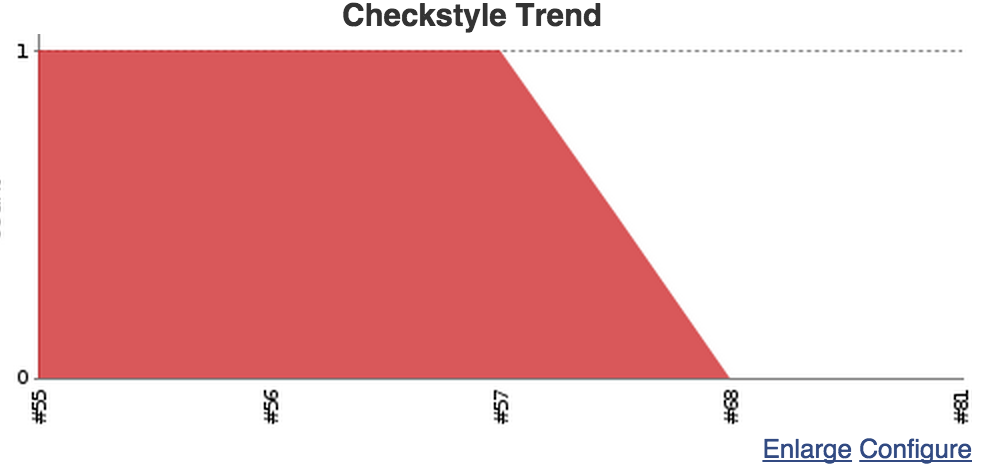
In our build we ran gulp lint and stored the output in build/checkstyle-report-coffee.xml so let’s point checkstyle plugin to it:
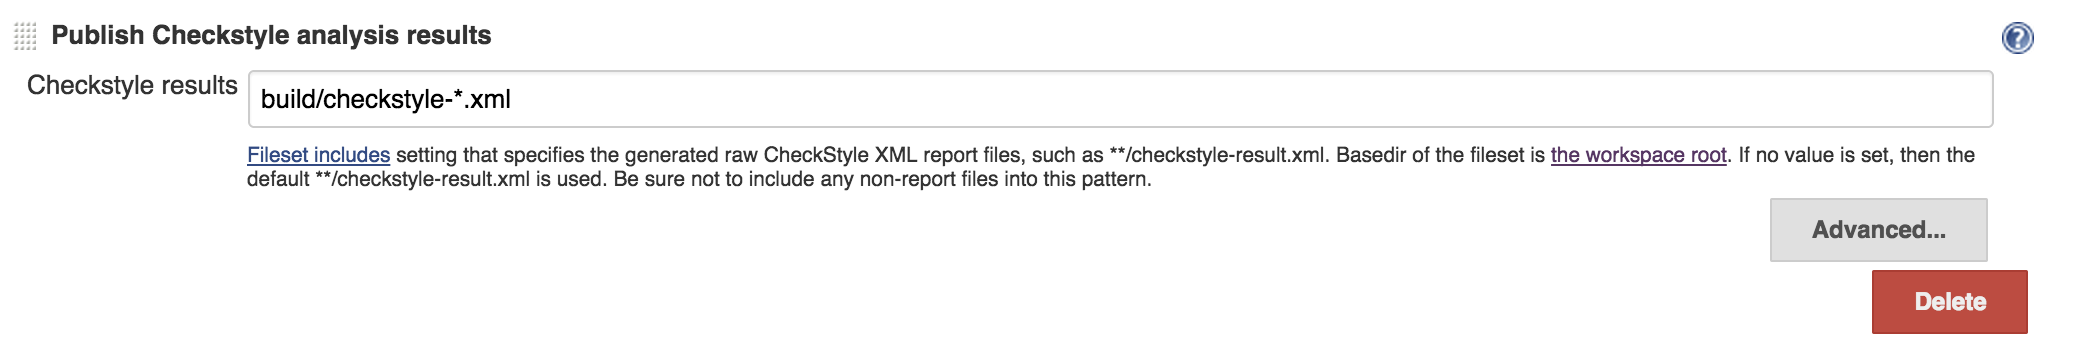
What we’ll get is nice report pages where we can drill down to see what the warnings and errors are, in which files, line numbers and event see the line of code. We’ll get nice summery on job page, also trend graph.
Open tasks
Another thing that would be helpful is to know if there are open tasks in project and if there are, what those are. Jenkins has a way to detect tags like TODO, FIXME and others. It scans the code to find those, let’s configure it. Notice that I’m excluding node_modules to not count open tasks in dependency modules.
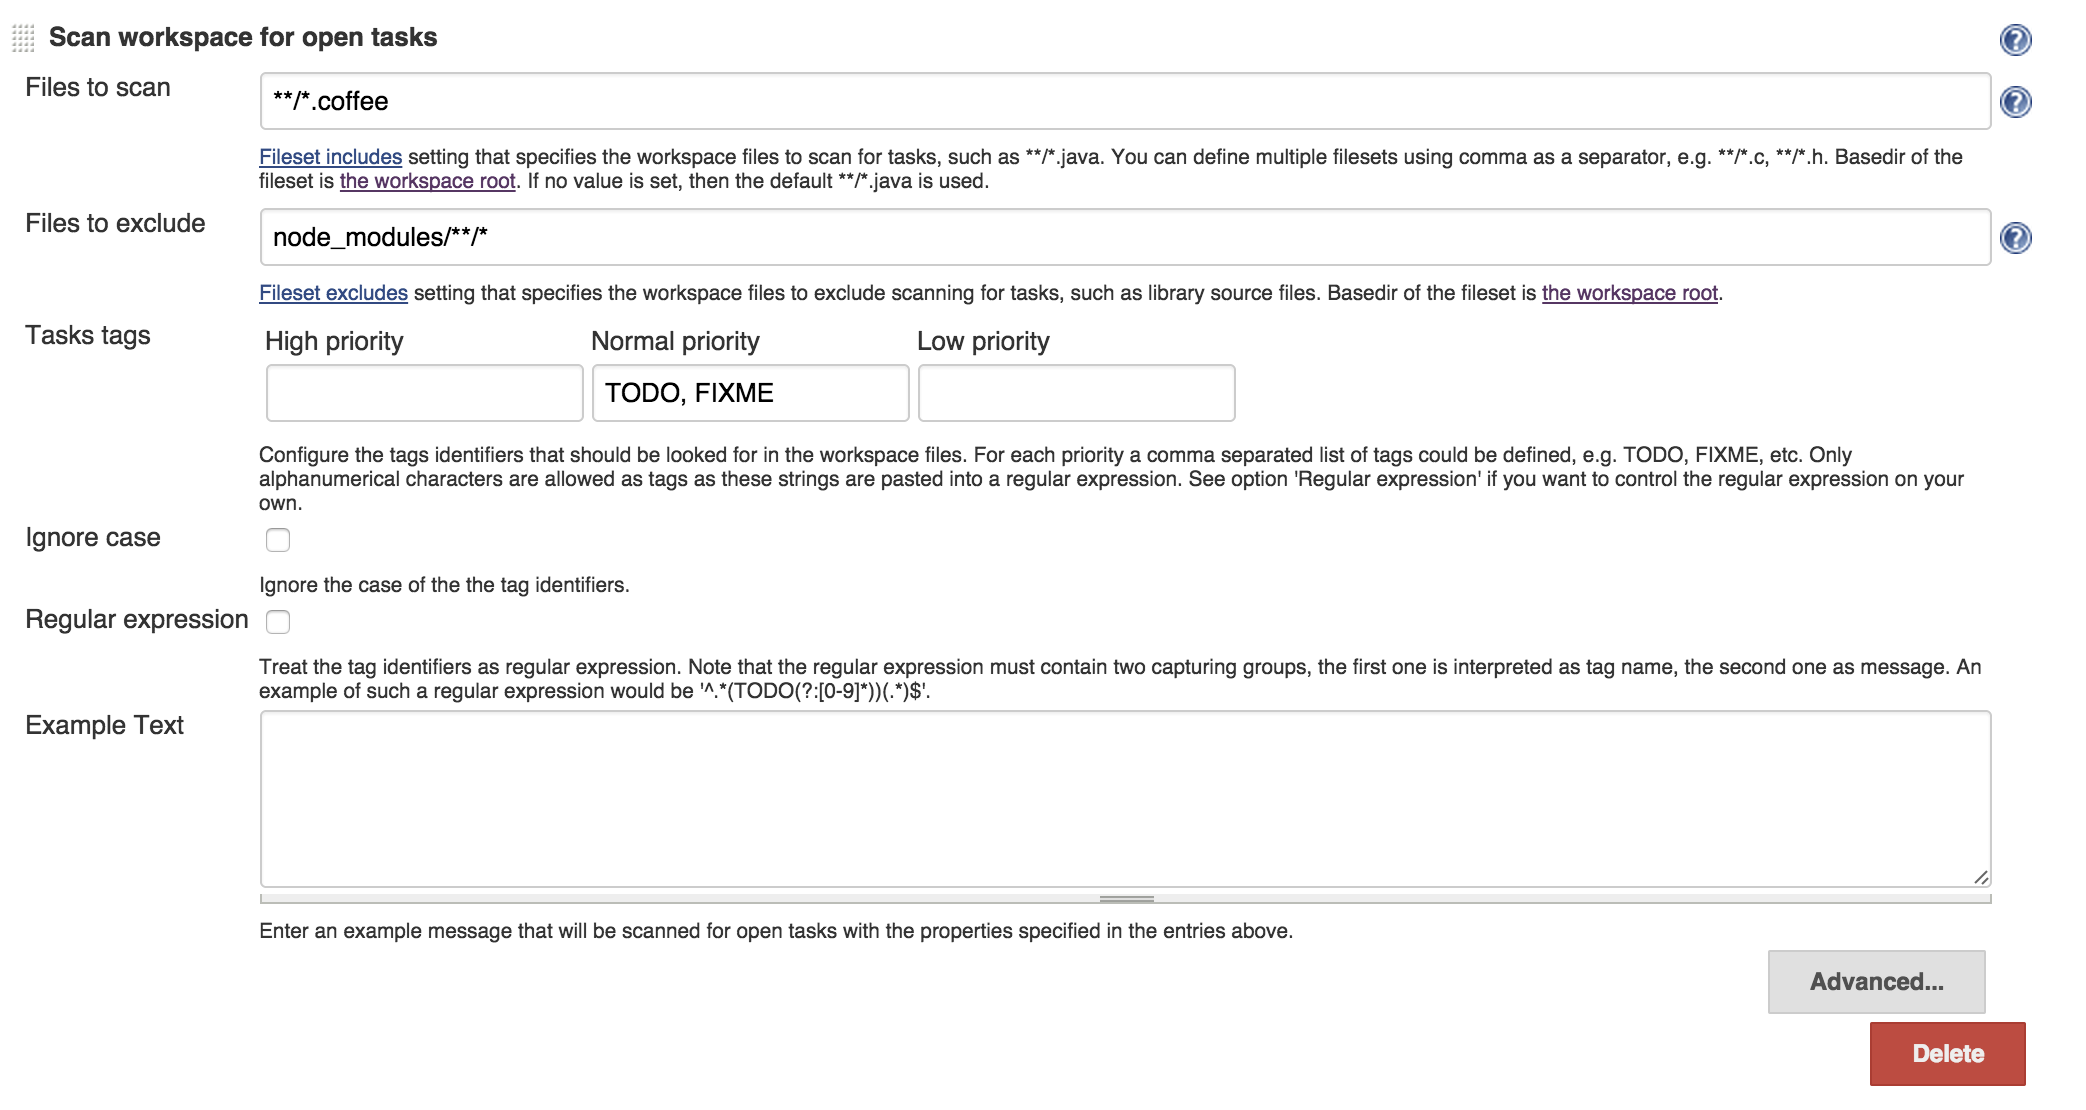
What we’ll get is a nice reports and trend graph on our job page.

Unit tests
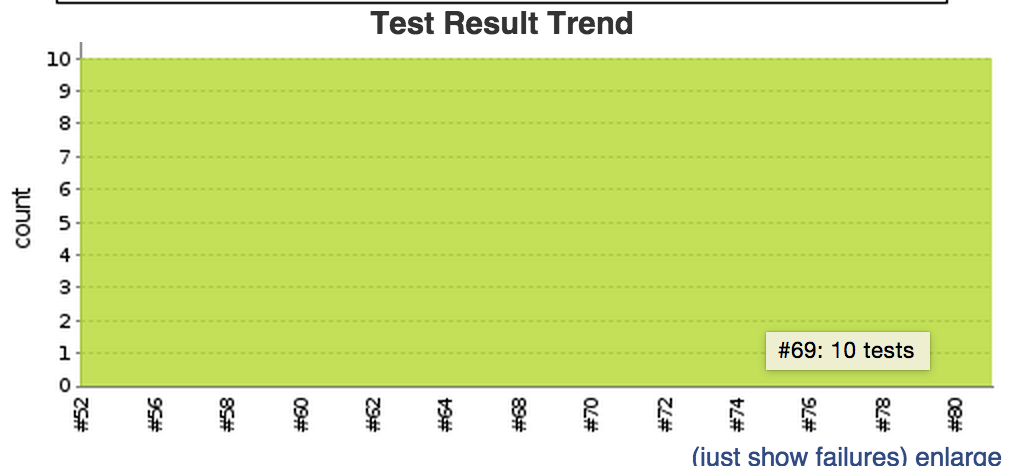
In our build script we put JUNIT_REPORT_PATH=build/test-report.xml so our jUnit xml reports file are in that file, let’s just point jenkins to it.
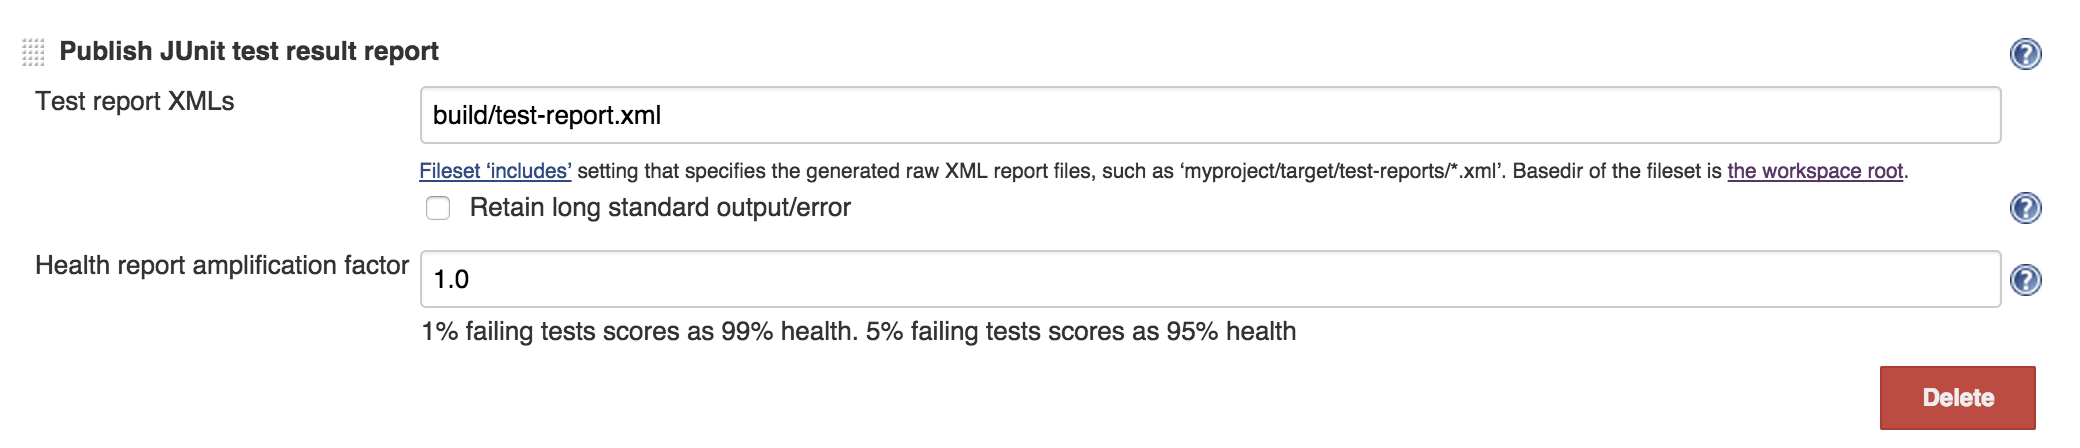
What we’ll get is a nice reports and trend graph on our job page.
Code coverage
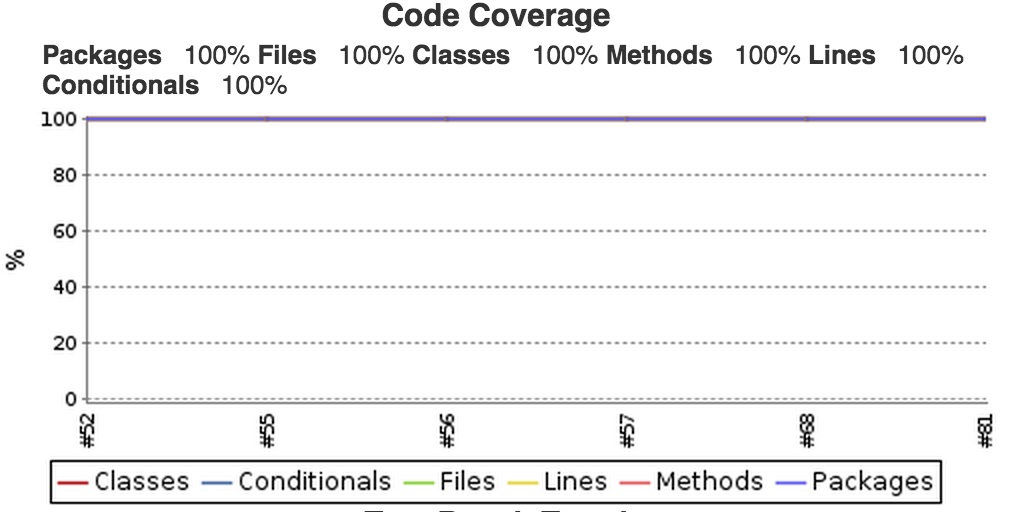
When unit testes are passing it’s still not enough we want to measure what the code coverage is and of course find code paths that are never being hit from a unit tests. If you look in my gulp files you’ll see that it generates cobertura reports also (in build/coverage/cobertura-coverage.xml file.) So let’s use it.
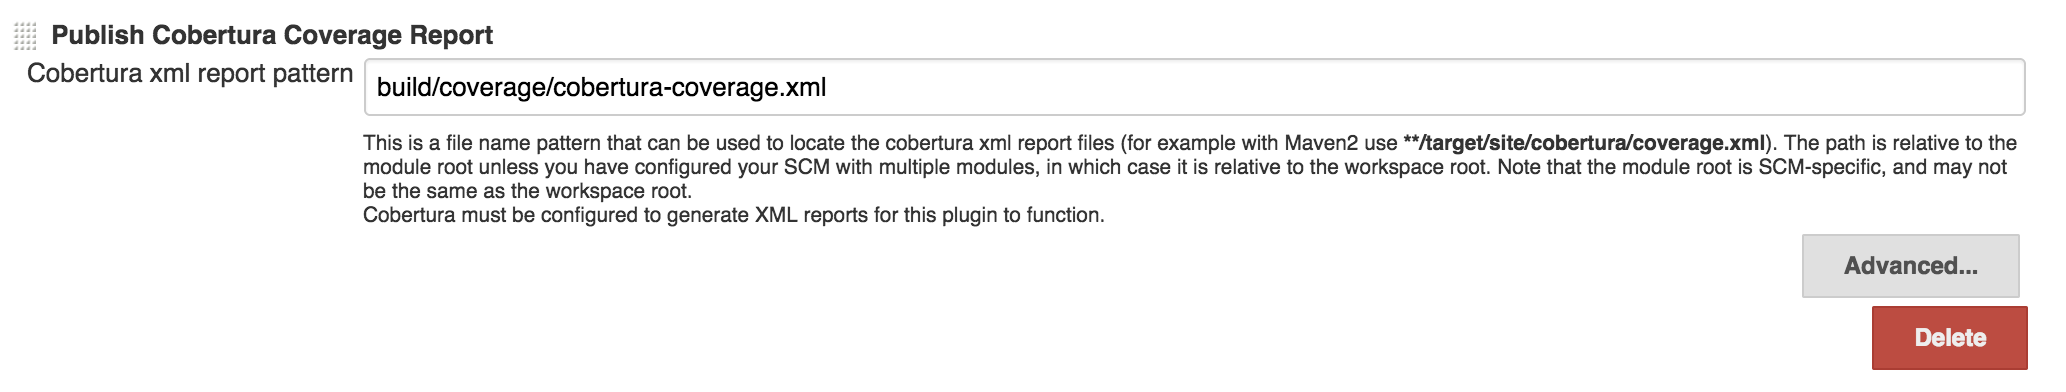
What we’ll get is a nice reports and trend graph on our job page.
Output of the build
We define build to be a pipeline of checks that the code goes through every time there is a commit. We torture every single commit to go through this pipeline and we say if build passes commit is good. So what is the output of the build? Also we only deploy good changes, right? The output of a good build would be the artifacts. We worked really hard to make sure that code is good by running series of checks on it and we better keep those artifacts for deployment. Since this one project is a library project the artifact is the npm package and I’m publishing it to my npm repository (in may instance nexus, you may use npmjs.) In case of server apps artifact can be a docker image job will build and push to docker registry. For other type of projects zip file can be good enough, just version it and put on S3 or something.
Versioning
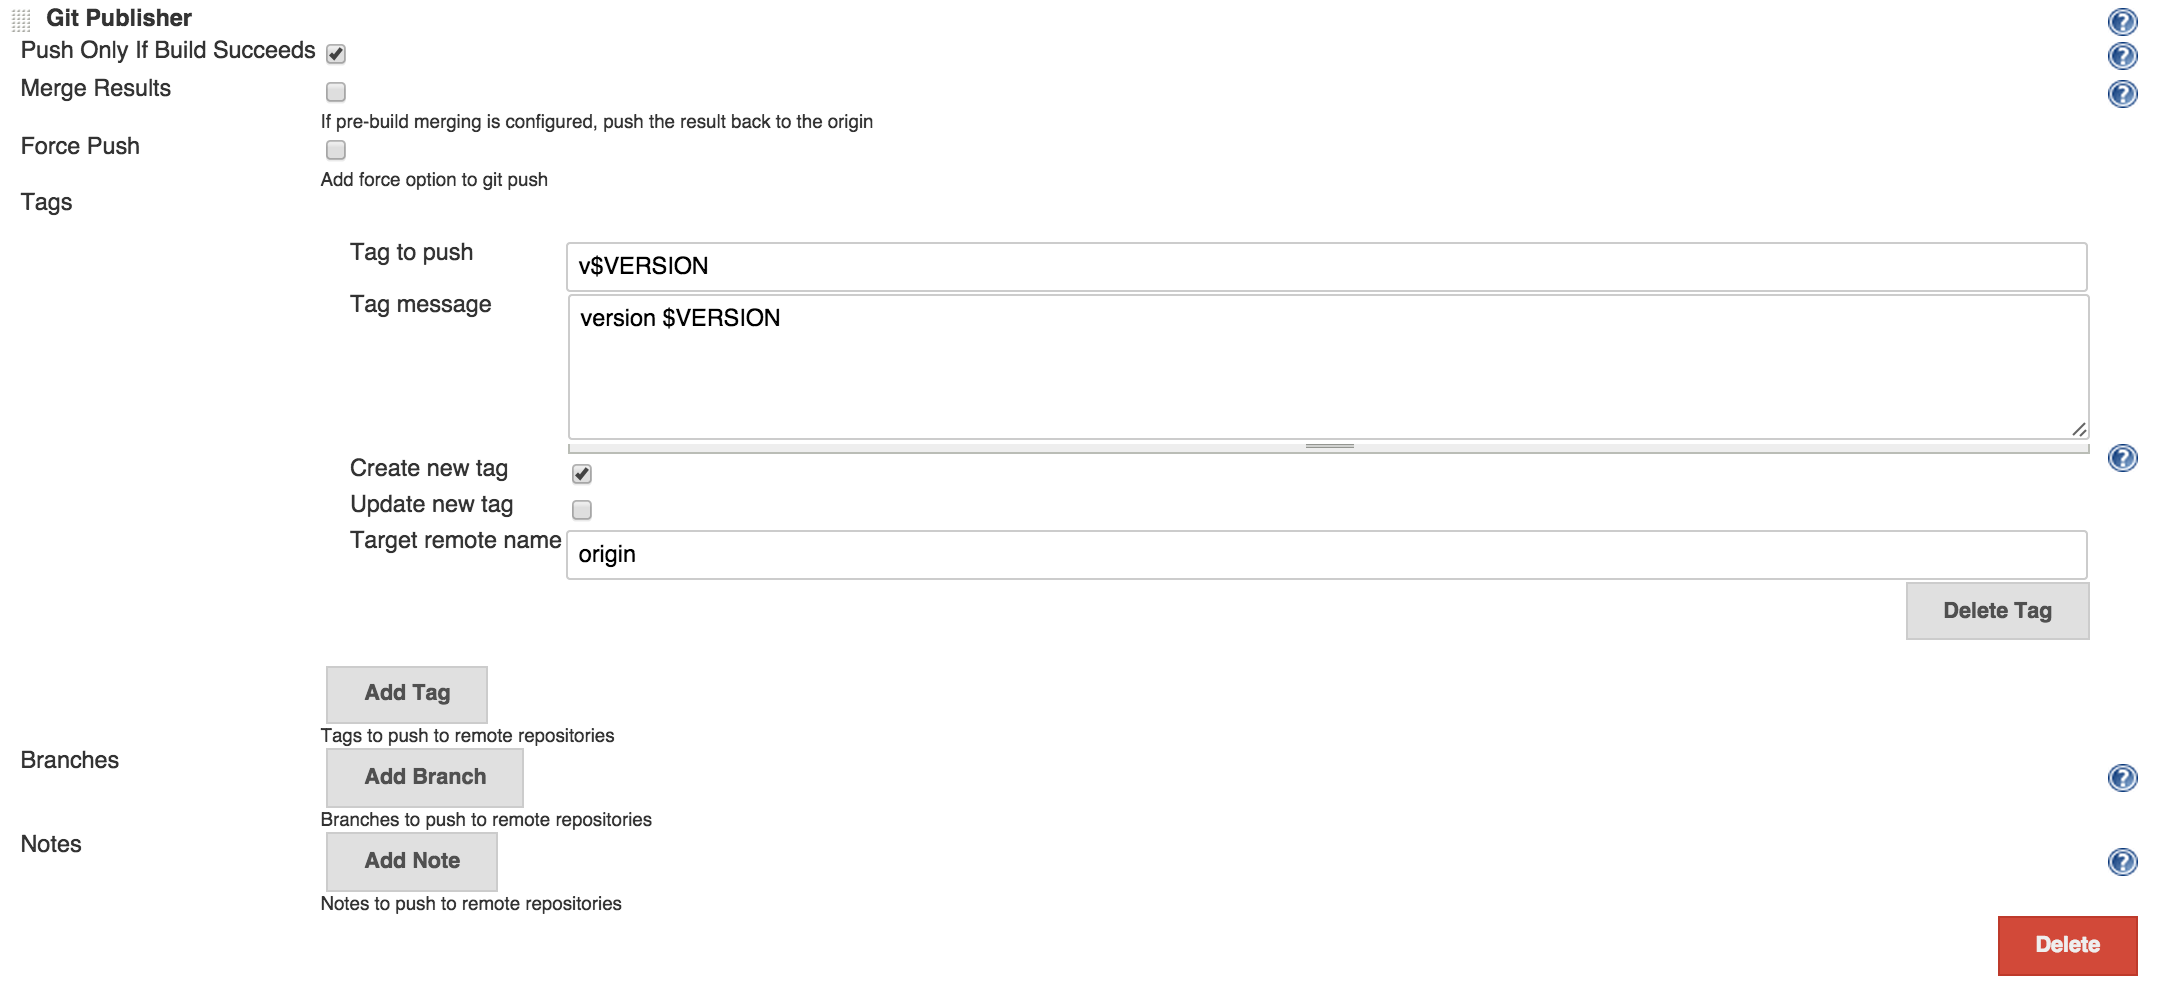
And since every good commit produces an artifact (in this case npm package is the artifact) we should talk about versions. One thing that would be good if we could link a specific version of an artifact to source code. A good way to do this is to create a tag on commit when we build the artifact. We already have the version in package.json, I defined version gulp task to get it and was doing some serious gymnastics in build script to get it into VERSION environment variable. I would just use Git publisher functionality of Jenkins to create a git tag with that version.
Notifications
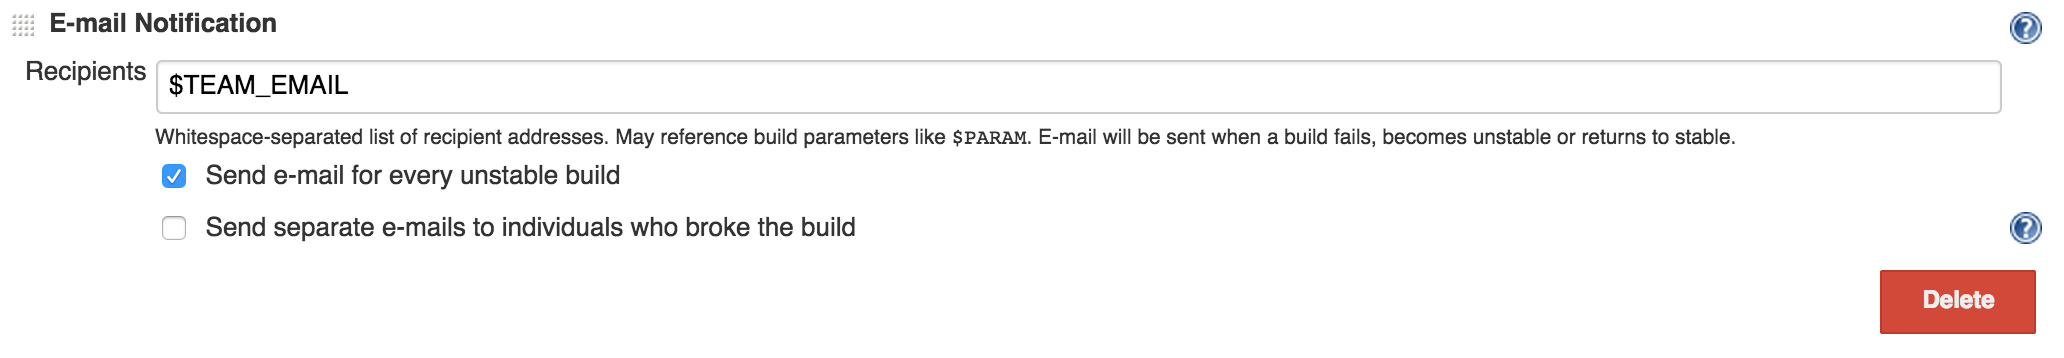
So build pipeline is there, now every time there is a commit in source control build will trigger and it will either fail or pass. Either way we get instant feedback which was one of the main problems we wanted to solve. You can get notifications when job stars, fails or succeeds. I generally don’t care to be notified when a job succeeds unless it’s deploy job or something (which I won’t be covering in this post.) but I absolutely care to know when a build job is failing. You can do pretty much all types of notifications: Email, Slack, Hipchat, IRC, IM whatever you’re using, Jenkins has plugins for all of those. I personally like to send an email out when a job fails and put a message in a Slack room when a job starts or finishes.
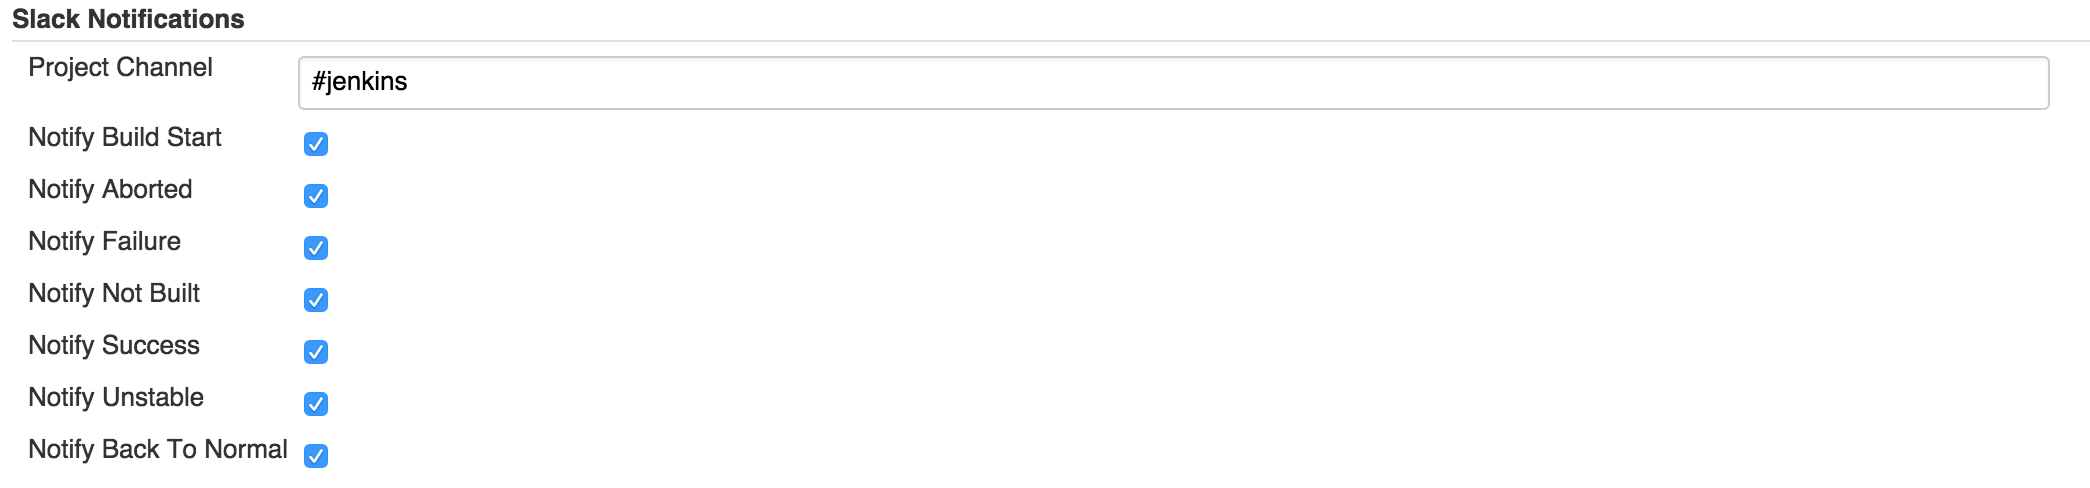
And include Slack notifications at post build step at the bottom of job configuration.

Pull requests
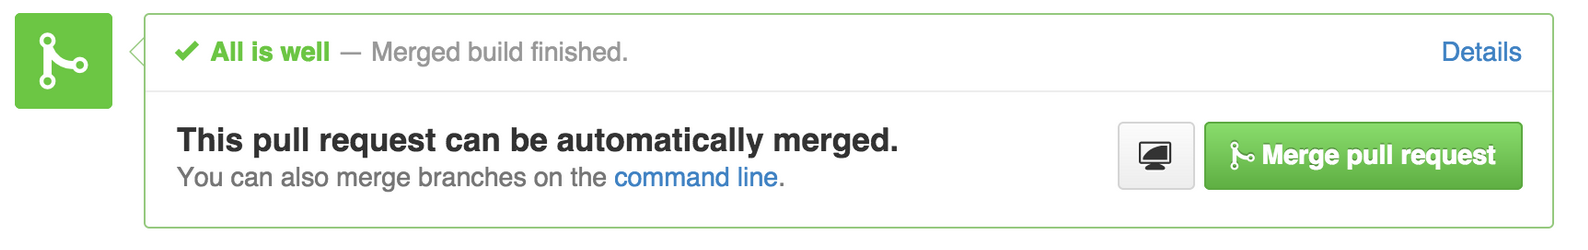
Remember I said it would be better to know if a commit is good before it even gets to mainline. With the setup mentioned so far when a commit gets to master build will trigger and if it’s bad job will fail. To not allow bad code to even get to master at first place we need to run integration on it before merging it. We never merge a branch when you do code review and identify that it needs more work, right? But what you can’t tell from just code reviewing is if it compiles, unit tests are passing, what is code coverage after the change, etc. And do we even want to code review a change if build will fail for it? What we need to do is to have a magical way that when we go to review a pull request somehow it has a flag on it saying build is passing for it or no. There is a Jenkins plugin for building pull requests also, it will run the build, and comment github pull request.
To get this working all you need to do is to create another job that instead of building master will build pull requests. For this job there are few things we don’t actually need. We don’t care do generate scala docs for this type of builds, version or publish the artifacts, so make sure to exclude those steps from pull request builder jobs.
Wrapping up
Let’s see what we got. Every time there is a commit build will start immediately and we’ll get instant feedback whether build passes or fails. If build passes we know that all checks we defined are good for the commit. We create tags for each version in git, we publish artifacts for deployment or referencing from other projects. Other than those we get lot of nice features on Jenkins dashboard.
- We can see the status of the build.
- See the change log with commit messages, committers and links to github.
- We can browser the workspace.
- Start a build.
- Navigate to github page of the project.
- See detailed reports for checkstyle or other static analysis warnings.
- Navigate to scala docs.
- See code full coverage reports with percentages, which lines are covered which ones aren’t, classes, packages.
Make sure to also check out my other posts about gulp files and how to run node apps in docker: